Research in Estuarine Ecosystems: Various Harmful Species in the Neuse Estuary
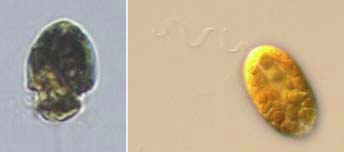
Harmful taxa Heterocapsa rotundata (left) and Heterosigma akashiwo (right).
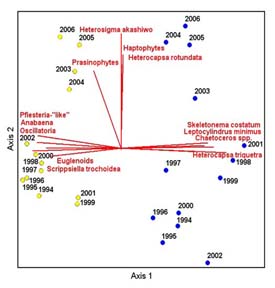
Use of long-term data and multivariate ordination techniques to identify environmental factors governing estuarine phytoplankton species dynamics. From Rothenberger et al. (2009).
The CAAE has also characterized blooms in the Neuse Estuary that have been dominated or co-dominated by Prorocentrum minimum (e.g. see Springer et al. 2005, Harmful Algae 4: 533-551). The developing bloom was first detected from a web-based alert provided by the Center’s real-time remote monitoring (RTRM) platforms, indicating elevated dissolved oxygen (DO) and pH levels in the upper estuary. These data were used to augment shipboard sampling in characterizing bloom initiation, development, movement, and dissipation over a 7-month period (October 2001-April 2002).
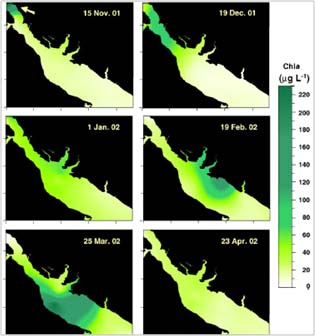
Chlorophyll a concentrations (depth < 2.0 m) during a 2001-2002 dinoflagellate bloom,indicating temporal and spatial changes in phytoplankton density (n = 44 samples from 22 sites). Arrow indicates the upper-most salinity influence; note that the first panel (15 Nov 01) is representative of chla levels from mid-October through November. From
Springer et al. (2005).